|||
✕
Home
Medium
Search
Feed
Work Archive
About
↑
Jan 24, 2021
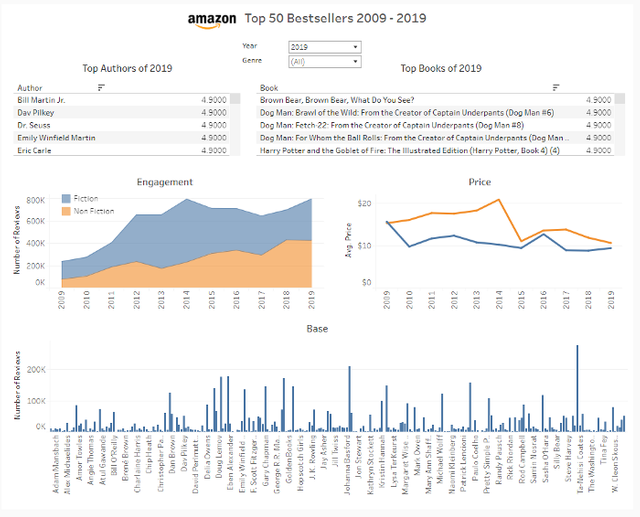
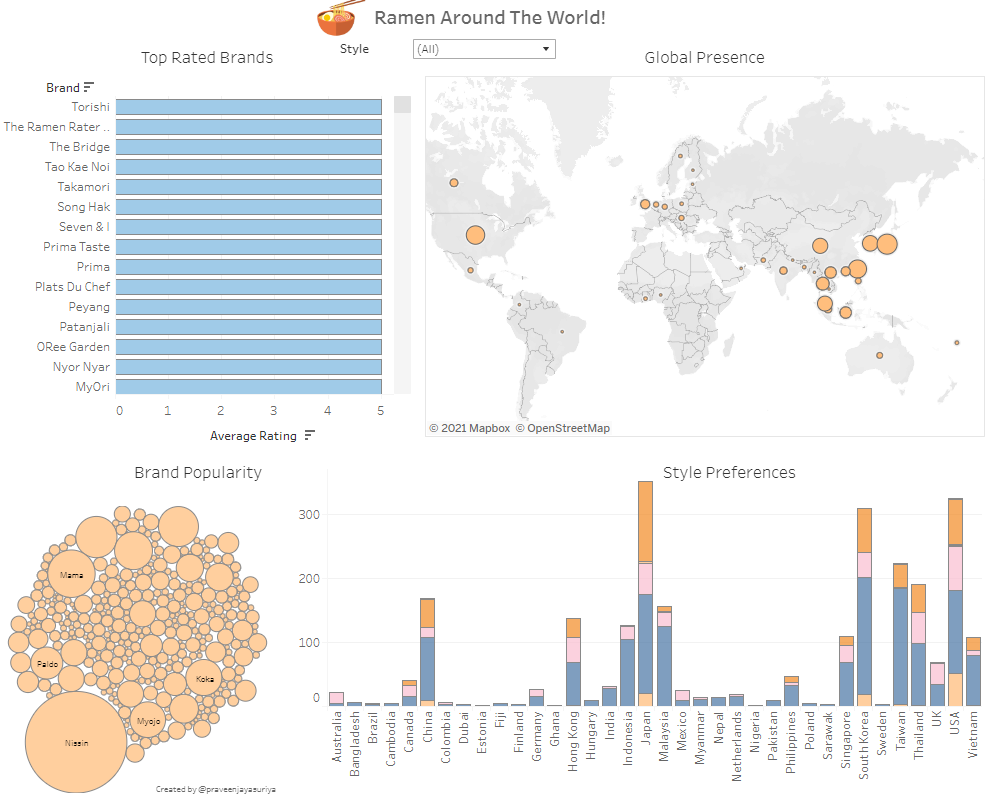
Tableau Visualisation of The Week — Ramen Around The World!
Who doesn’t love ramen?
Ramen Around The World!
The Tableau Public version of this dashboard is here
Up next
Tableau Visualisation of The Week — Amazon Top 50 Bestsellers 2009–2019
Least Squares Optimised Fit Using Python— A Basic Guide
Latest posts
Least Squares Optimised Fit Using Python— A Basic Guide
Tableau Visualisation of The Week — Ramen Around The World!
Tableau Visualisation of The Week — Amazon Top 50 Bestsellers 2009–2019
Generating Simulated Data Points That Follow a Give Probability Density Function
The Probability Density Function of a Natural Logarithm
Log Plots, Kernel Density Estimation and Experimental Data
NEAs — Exploring Sentry Data
Near Earth Asteroids, an Exploratory Analysis
Open edX on Digital Ocean, The Basics (Part 1)
Life Insurance Modelling with Python
The World Bank Climate API
A Personal Story About Blot.im
Stress Incontinence and Period Panties
Active Lighting Apparel for Runners
Synchronized Medical Image Viewer for Remote Consultation
Wireless Sensor Network for Air Quality Monitoring
 |||
|||
 Ramen Around The World!