 |||
|||
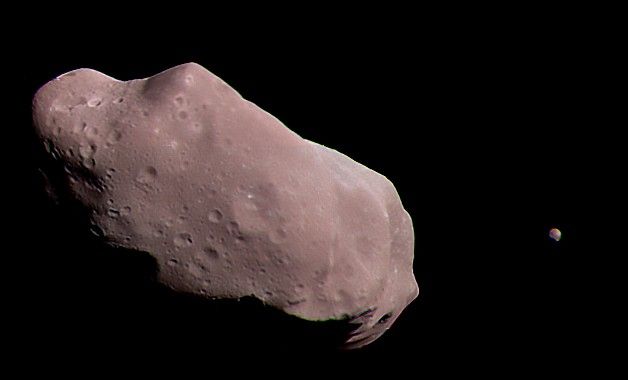 Fig 1 — Asteroid 243 Ida as seen by the Galileo probe on August 28, 1993. Image Credit: NASA/JPL/Processed by Kevin M. Gill, Ida’s moon Dactyl is on the right
Our Solar System is a strange place and there’s a lot we don’t know and don’t fully understand. There’s no better way to reflect on this point than to take a historical perspective. The discovery and characterisation of the planets and other bodies in our Solar System can serve as a great starting point. I’ve been spending some time on Solar System dynamics and thought I’d take a close look at asteroids, specifically the Main Asteroid Belt between Mars and Jupiter as well as Near Earth Asteroids (NEAs). There’s much to learn here so let’s dive in!
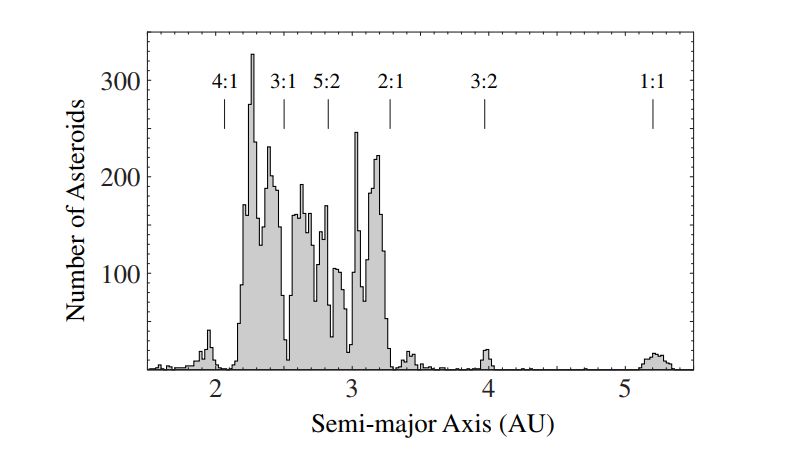 Fig 2 — Asteroids are more abundant in the inner regions of the Solar System, (image credit, Murray, Carl D., and Stanley F. Dermott. Solar System Dynamics. Cambridge: Cambridge University Press, 2000)
Taking a modern perspective, asteroids are minor planets and as the classification suggests, they tend to be significantly smaller than a planet or planet moons. The term is more commonly used to describe the group of small objects that inhabit the inner portions of our Solar System. Around 200 years ago very little was know about these small objects. The first asteroid to be discovered, Ceres (or 1 Ceres) was only discovered in 1801.
Ceres is a beautiful object, nearly spherical to the point where it was initially considered to be a planet. Ceres was subsequently classified as an asteroid in the mid-1800s and 2006 was re-classified as a “dwarf planet”. The distinction is somewhat important as Ceres has a considerably higher mass and radius compared to it’s smaller asteroid neighbours. The taxonomy can be a little confusing and for a long time, some of these terms were used interchangeably. To this day it can be quite challenging to pin down a concrete definition that works for all situations and objects. Asteroids are not to be confused with comets, which have highly eccentric (“elongated”) orbits around the sun as well as spectral properties that differ from asteroids and are known to originate in the outer regions of the Solar System. We will look at comets in a little more detail when we examine the Near-Earth Object (NEO) data in posts to come.
It is worth mentioning that the Titus-Bode “Law” played an important role in the discovery of asteroids, but Giuseppe Piazzi,who discovered Ceres, did so by accident without the use of this empirical rule. The Titus-Bode “Law” probably deserves a post as it has a colourful and rich history. This “empirical rule” has since been debunked, most notably by the excellent statistical analysis by Dermott in 1972/197³³, but alas that is for another post and another time. If you’ve got the inclination and the background, I highly recommend reading the paper as it is a masterclass in statistical thinking and analysis. Since the discovery of Ceres, much progress has been made in understanding the dynamics and composition of the asteroids¹ and there has been significant commercial interest in mining these objects for resources² as asteroids are known to contain carbon, silicon, iron, nickel as well as other metals and rocky minerals. Astronomers estimate that there may be billions of asteroids with dimensions > 100m in our Solar System alone.
Several metrics can be used to characterise asteroids¹ and this data can, in turn, be used to classify them. The criteria that are most commonly used to classify asteroids are;
Studying the orbital characteristics can be an excellent starting point in gaining a deeper understanding of asteroids.
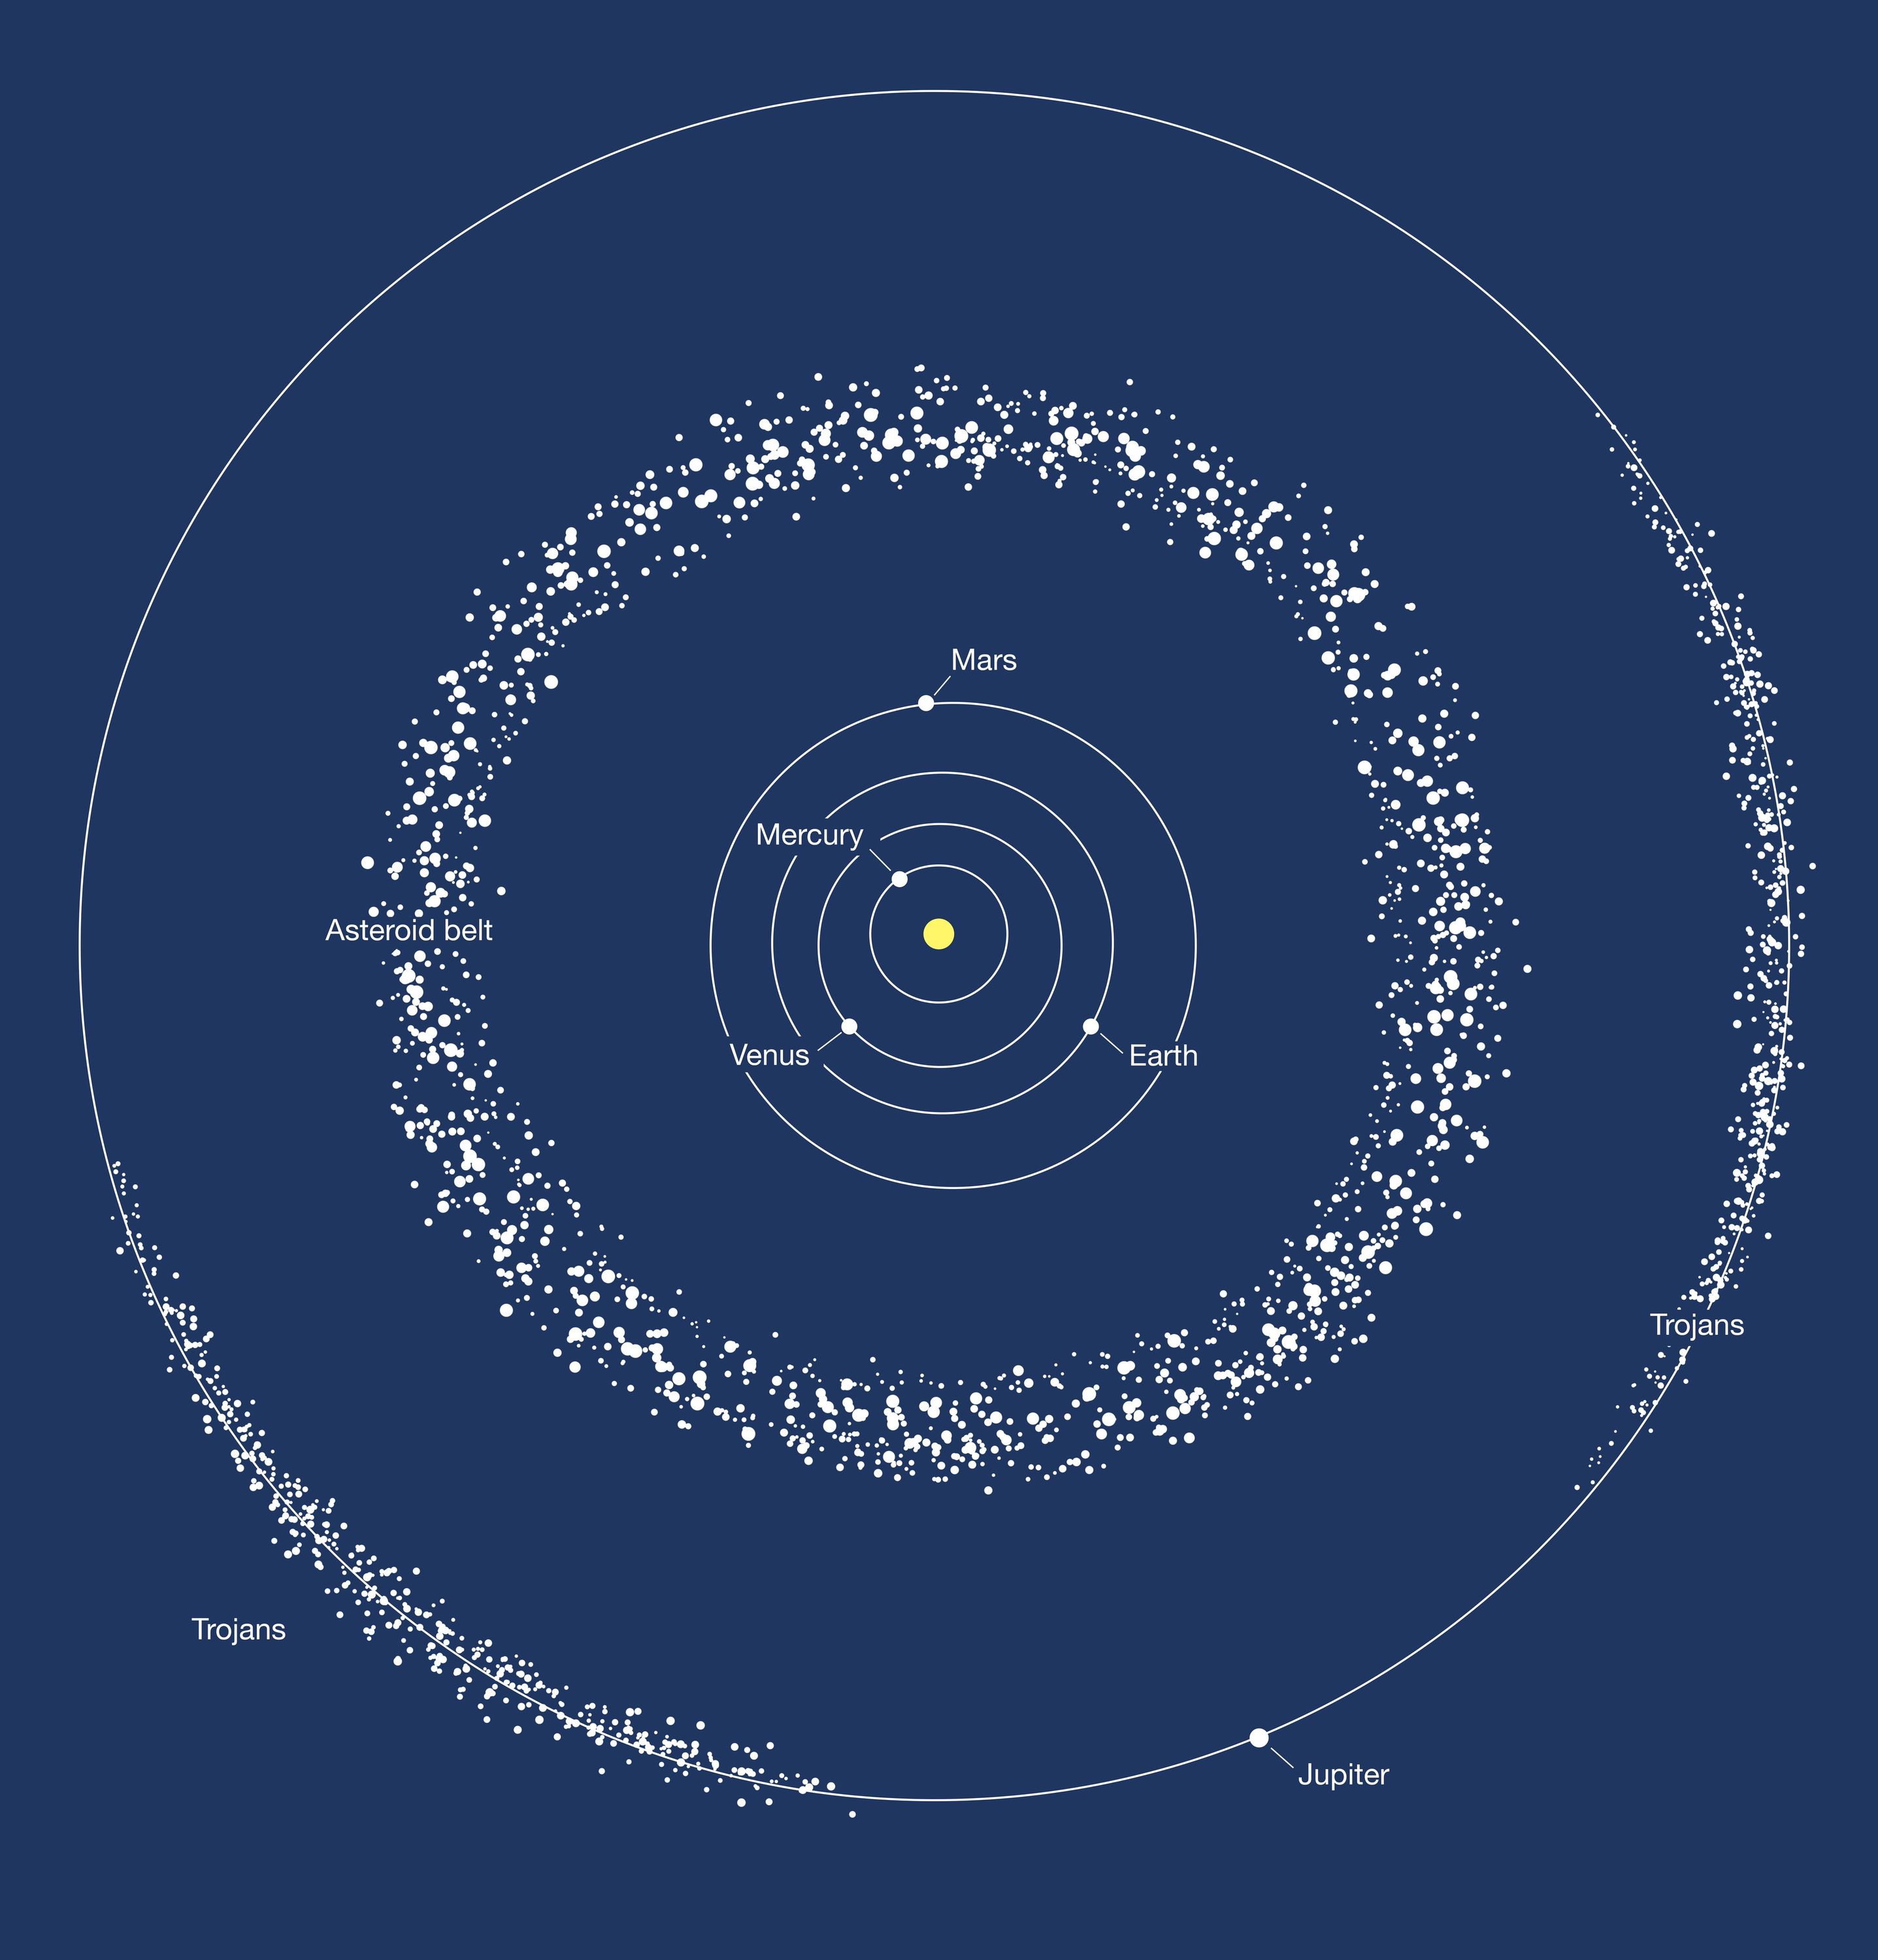 Fig 3 — This image depicts the two areas where most of the asteroids in the Solar System are found. The binary asteroid 288P is part of the asteroid belt. Credit: ESA/Hubble, M. Kornmesser
An important point to consider when considering the orbital characteristics of the objects in the Main Asteroid Belt is that the belt has structure. Much like the rings of Saturn, the Main Belt has zones or gaps that are virtually free of objects. These gaps are known as Kirkwood Gaps⁴ and are a result of Jupiter’s strong gravitation. There’s a fascinating relationship between these gaps and the orbital periods/radii in comparison to Jupiter (see ratios in Fig 2 above) but we will not explore these features in this post. There’s a common misconception (perpetuated by science fiction) that asteroids in the Main Belt tend to be densely packed. Asteroids are fairly sparsely distributed with distances of the order of millions of kilometres separating them from each other. Astronomers have also grouped asteroids into families based on their orbital characteristics and it is hypothesised that certain families were formed as a result of the destruction of larger composite objects as these families also tend to have similar compositions⁵
Another misconception is that all asteroids are solid, rocky objects. However, analysis of the data provided by the Hyabusa spacecraft on the asteroid Itokawa has indicated that asteroids can be loosely coupled collections of debris with the overall structure of the asteroid having a lower than expected density⁶.
This post was largely inspired by some data I’ve been looking at and I realised that the data can serve as an excellent starting point for anyone who wants to study asteroids. We will explore a specialist dataset, and try to gain an understanding of the objects being considered using exploratory data analysis (EDA).
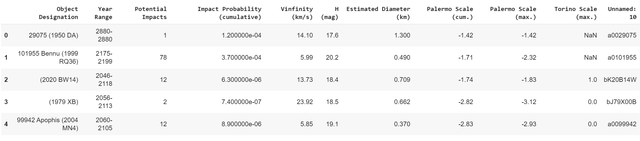
There has been considerable interest in detecting and studying Near-Earth Objects (NEOs) and Near Earth Asteroids (NEAs) which make up a majority of the NEOs. Near-Earth Asteroids are a special group of asteroids that tend to have orbits that can overlap or coincide with the orbit of the Earth. More specifically, these objects have perihelion distance less than 1.3 AU and yes this means that these objects may pose a significant threat of colliding with the Earth!
While open data has been made available to the wider community, the sources can be difficult to navigate if you don’t have a background in astronomy, databases and APIs. JPL’s Centre for Near-Earth Object Studies (CNEOS) is a bit of an exception in this regard. This excellent resource has several publicly available datasets which can be used to further our understanding of asteroids, albeit the ones that get close to Earth and it’s neighbours.
In the next post of this series, we will examine a subset of the observational data recorded and catalogued by CNEOS. Many excellent software packages have been made available to the community, however, I will assume that the reader will be using a fairly standard Python 3.7 distribution (Anaconda for example) without any specialised packages or environments.
[1] Bell, Jeffrey F., Donald R. Davis, William K. Hartmann, and Michael J. Gaffey. “Asteroids-The big picture.” In Asteroids II, pp. 921–945. 1989.
[2] Badescu, Viorel, ed. Asteroids: Prospective energy and material resources. Springer Science & Business Media, 2013.
[3] Dermott, S. F., and DERMOTT SF. “Bode’s law and the preference for near-commensurability among pairs of orbital periods in the Solar System.” (1972).
[4] Wisdom, Jack. “The origin of the Kirkwood gaps-A mapping for asteroidal motion near the 3/1 commensurability.” The Astronomical Journal 87 (1982): 577–593.
[5] Lazzaro, Daniela, Thaı́s Mothé-Diniz, Jorge M. Carvano, Cláudia A. Angeli, Alberto S. Betzler, Marcos Florczak, Alberto Cellino et al. “The Eunomia family: a visible spectroscopic survey.” Icarus 142, no. 2 (1999): 445–453.
[6] Fujiwara, Akira, J. Kawaguchi, D. K. Yeomans, M. Abe, T. Mukai, T. Okada, J. Saito et al. “The rubble-pile asteroid Itokawa as observed by Hayabusa.” Science 312, no. 5778 (2006): 1330–1334.